INFO features

Everything it does.

Four chapters: read a log, find the line, see the shape of the whole file, and keep what you found. Click a picture to see it large.

INFO chapter 1 · read

A log you can read while it is written.

Live, coloured, split into fields, and never slower than the process that writes it.

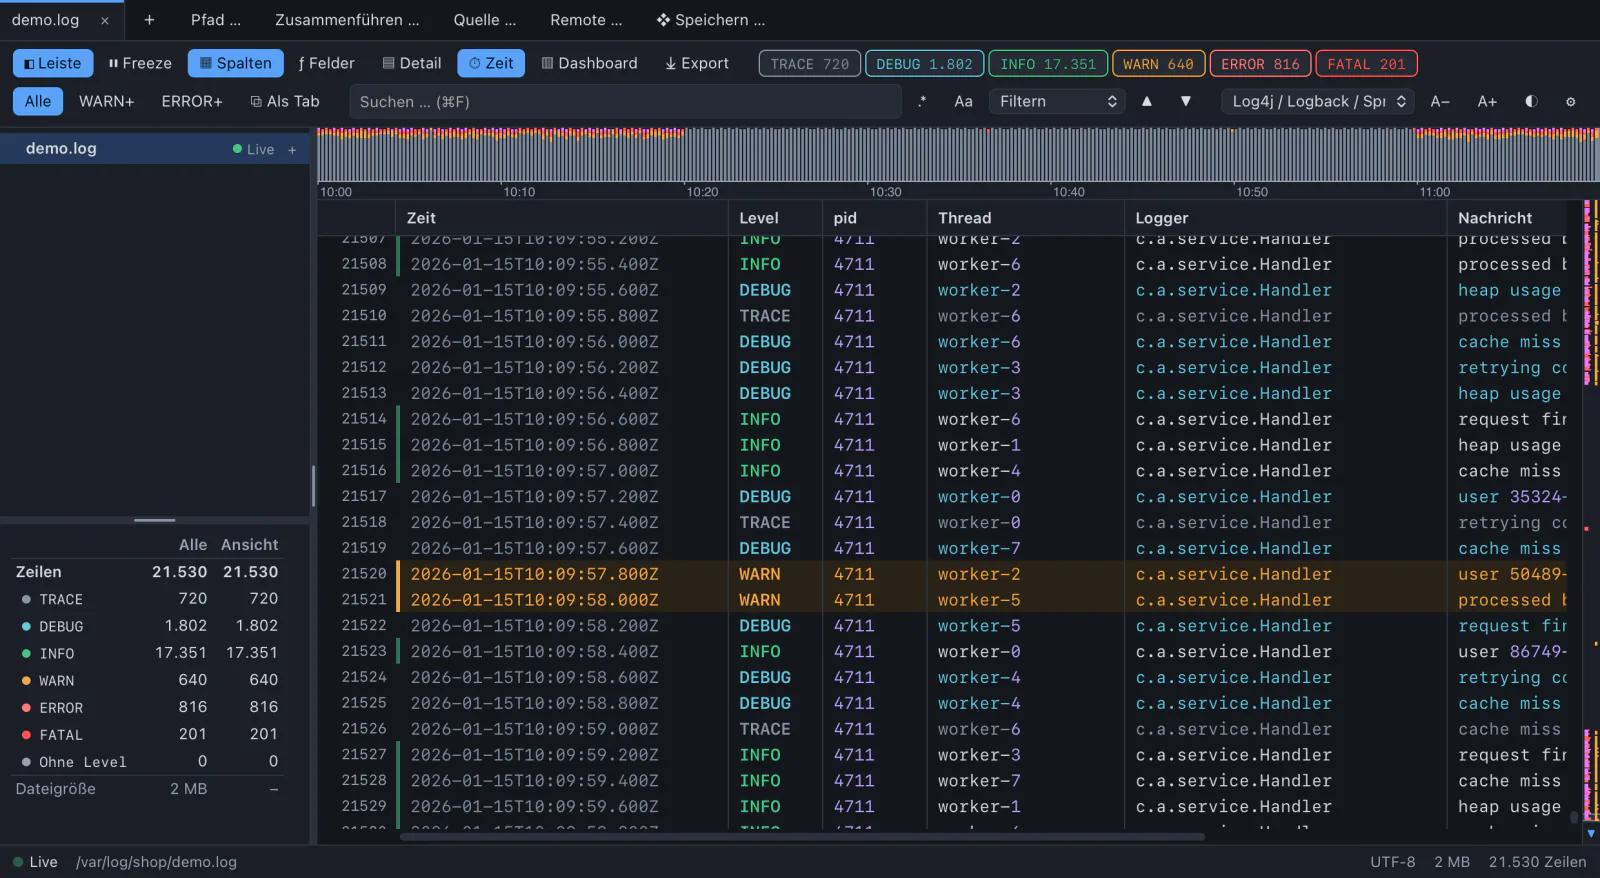
Live tail

New lines appear at once.

Log Commander notices when a file is emptied (> app.log), rotated (app.log → app.log.1) or disappears and comes back. It never blocks the process that writes.

While you are at the end, the view follows. Scroll up and it pauses and counts the new lines.

End F follow · Space pause
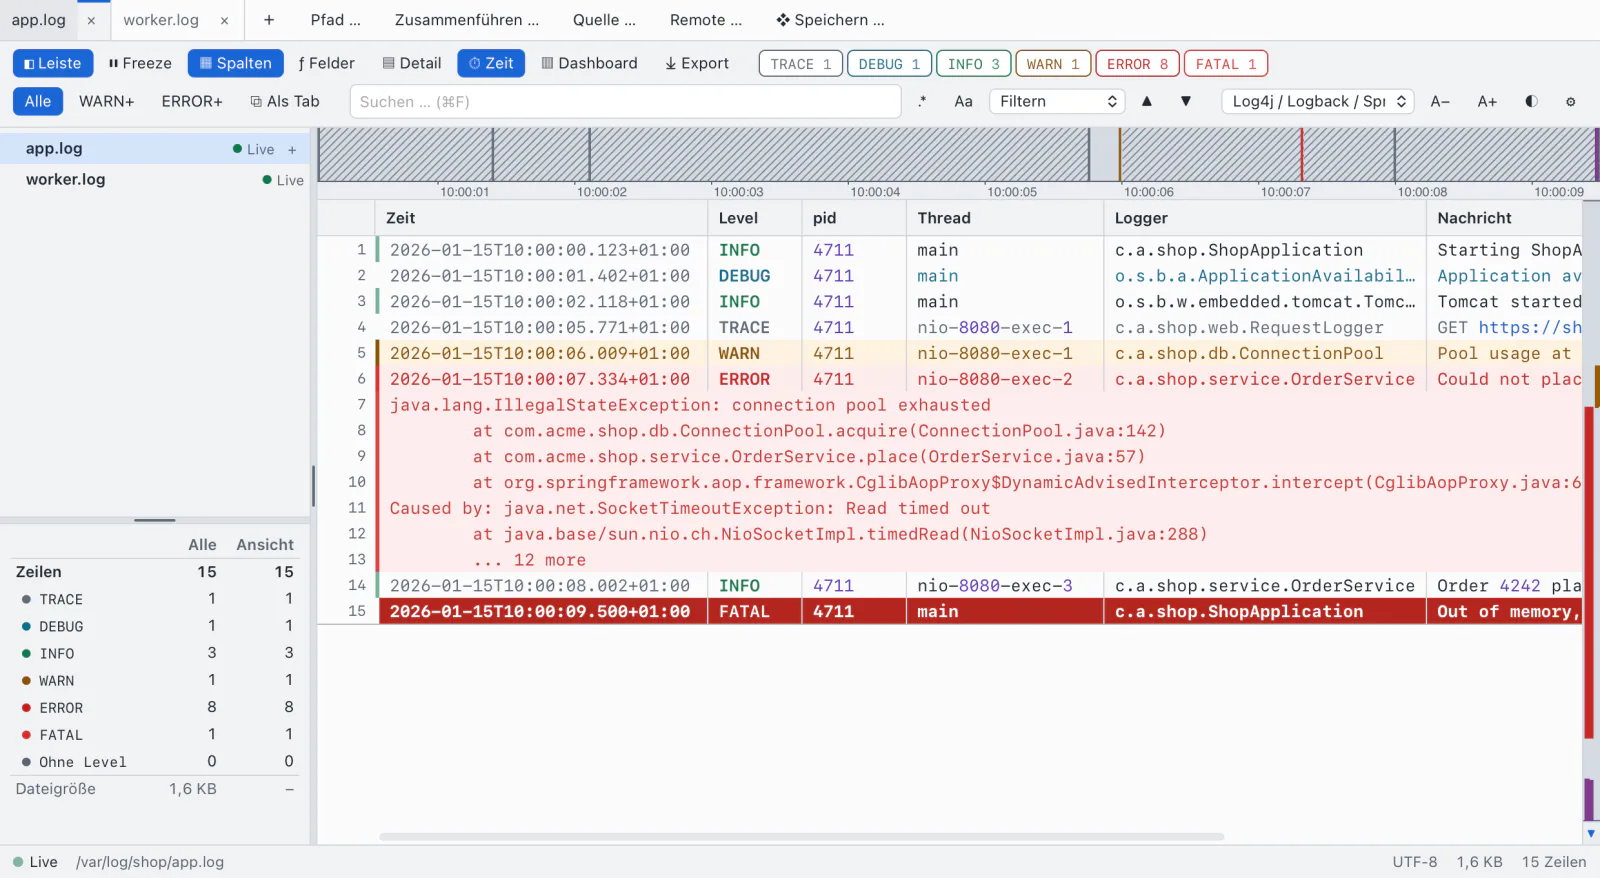
app.log
A live log in the dark scheme with level chips, sidebar and timeline

Levels and stack traces

TRACE to FATAL, each with its colour and a live counter.

Click a chip to switch a level, Alt-click to see only that one, double click for that level and worse. WARN+ and ERROR+ are one click away.

Continuation lines inherit the level of their entry. Filtering and selecting treat a stack trace as one unit.

E next error · W next warning
app.log · light
The same log in the light scheme

Formats and fields

Detected from the first lines. No setup.

Log4j, Logback and Spring Boot, Python logging, Serilog, syslog, nginx and Apache error logs, JSON Lines (with numeric Pino and Bunyan levels), access logs, W3C/IIS, NLog, Java GC, FIX and logfmt.

Each line is split into fields such as time, thread, level, logger and message. An unknown format is inferred. The profile tooltip says how well the format fits: “Log4j · 97 %”. Your own regex with named groups works too, with a live preview.

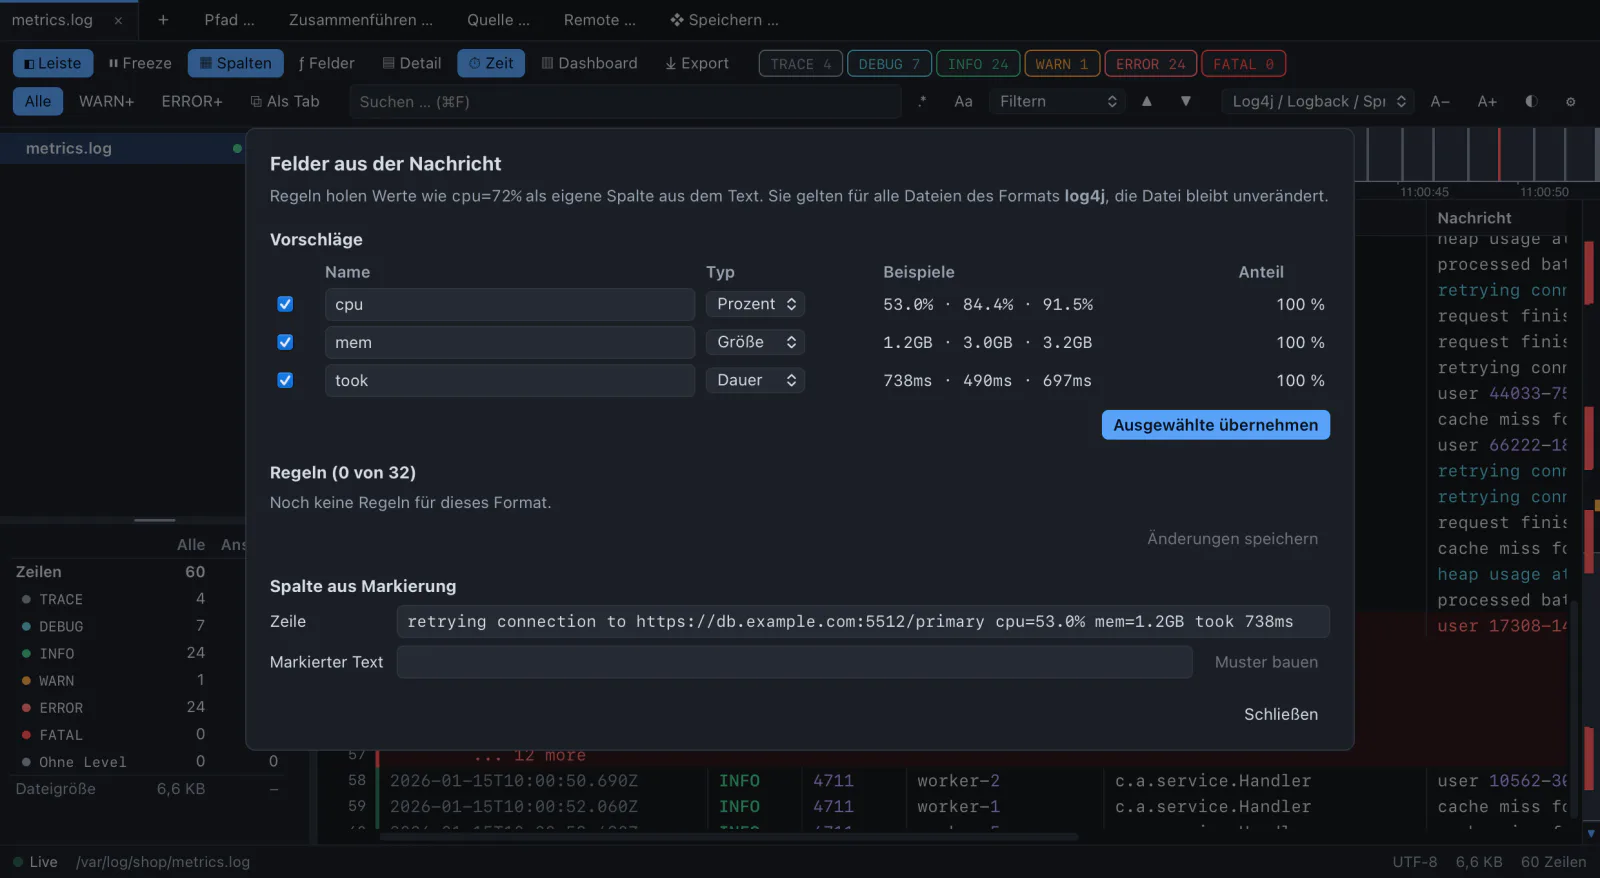
Fields
The fields dialog with suggestions, examples and their share

Columns

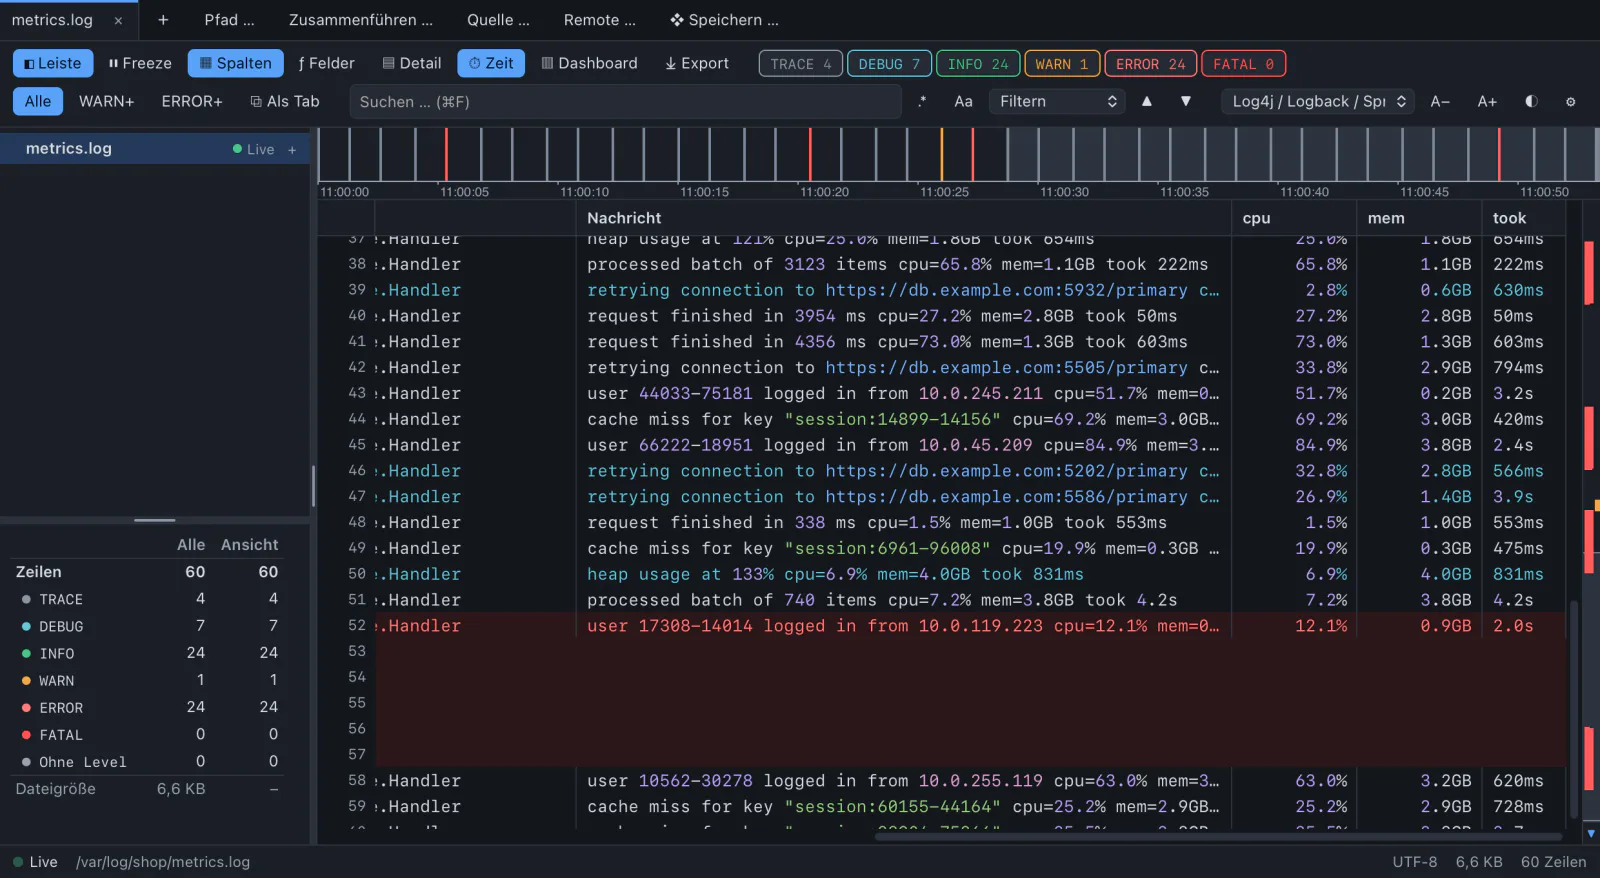
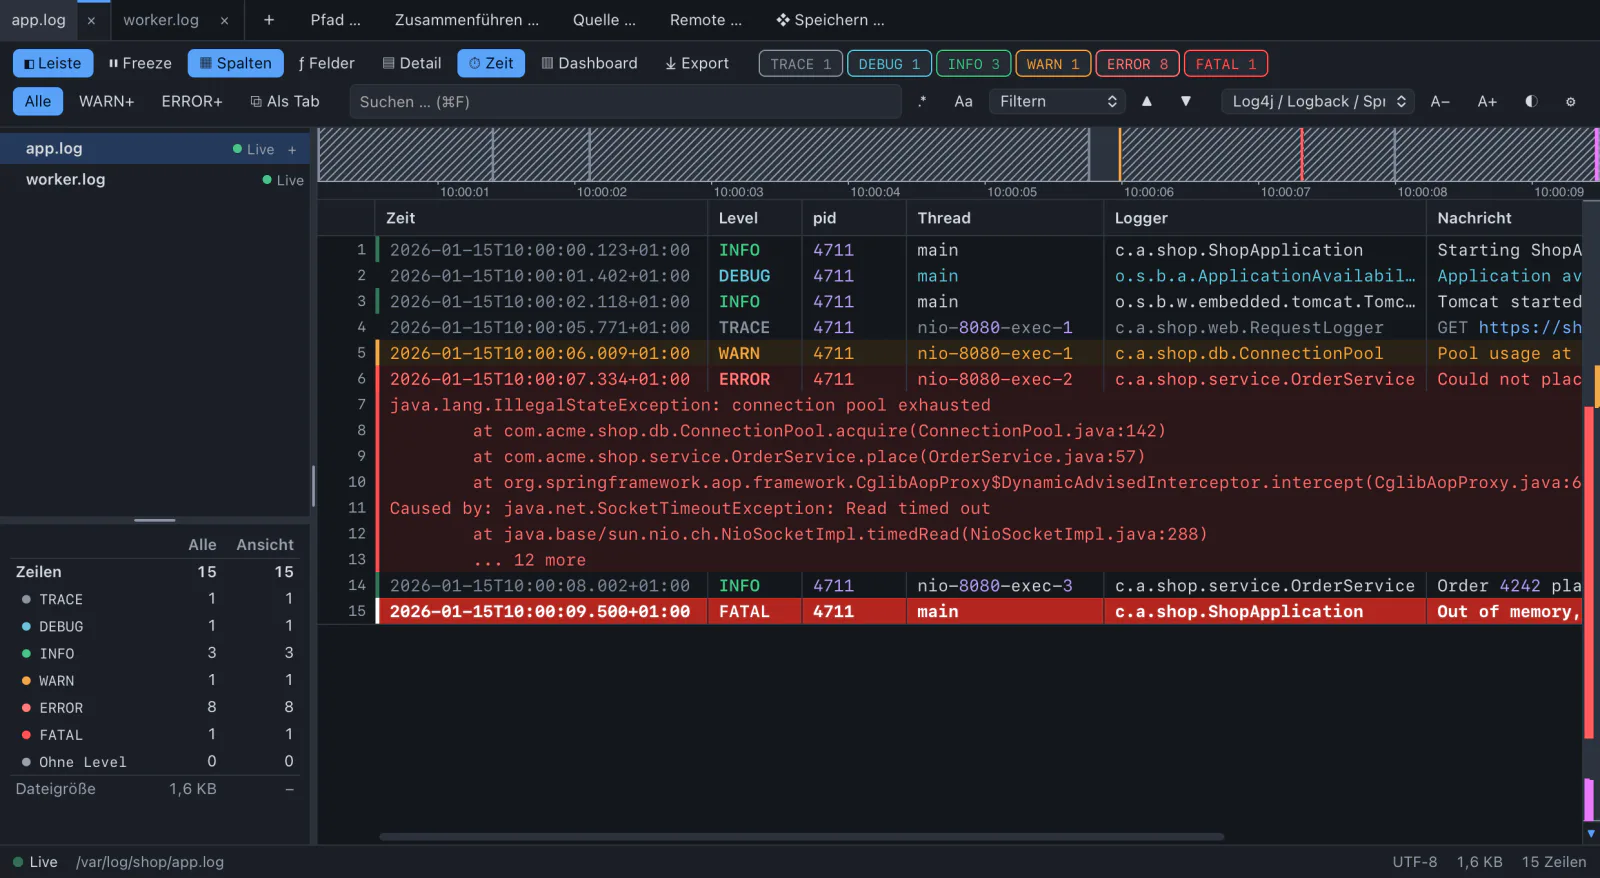
A recognised format becomes a table.

One column per field, stack traces across the full width. Drag an edge to resize, double click to fit, drag a title to move. The layout is remembered per format.

The view stays in file order. One key goes back to the raw lines.

T columns or raw · Shift+F10 column menu
app.log · extracted fields
Columns with extracted measurements

Detail panel

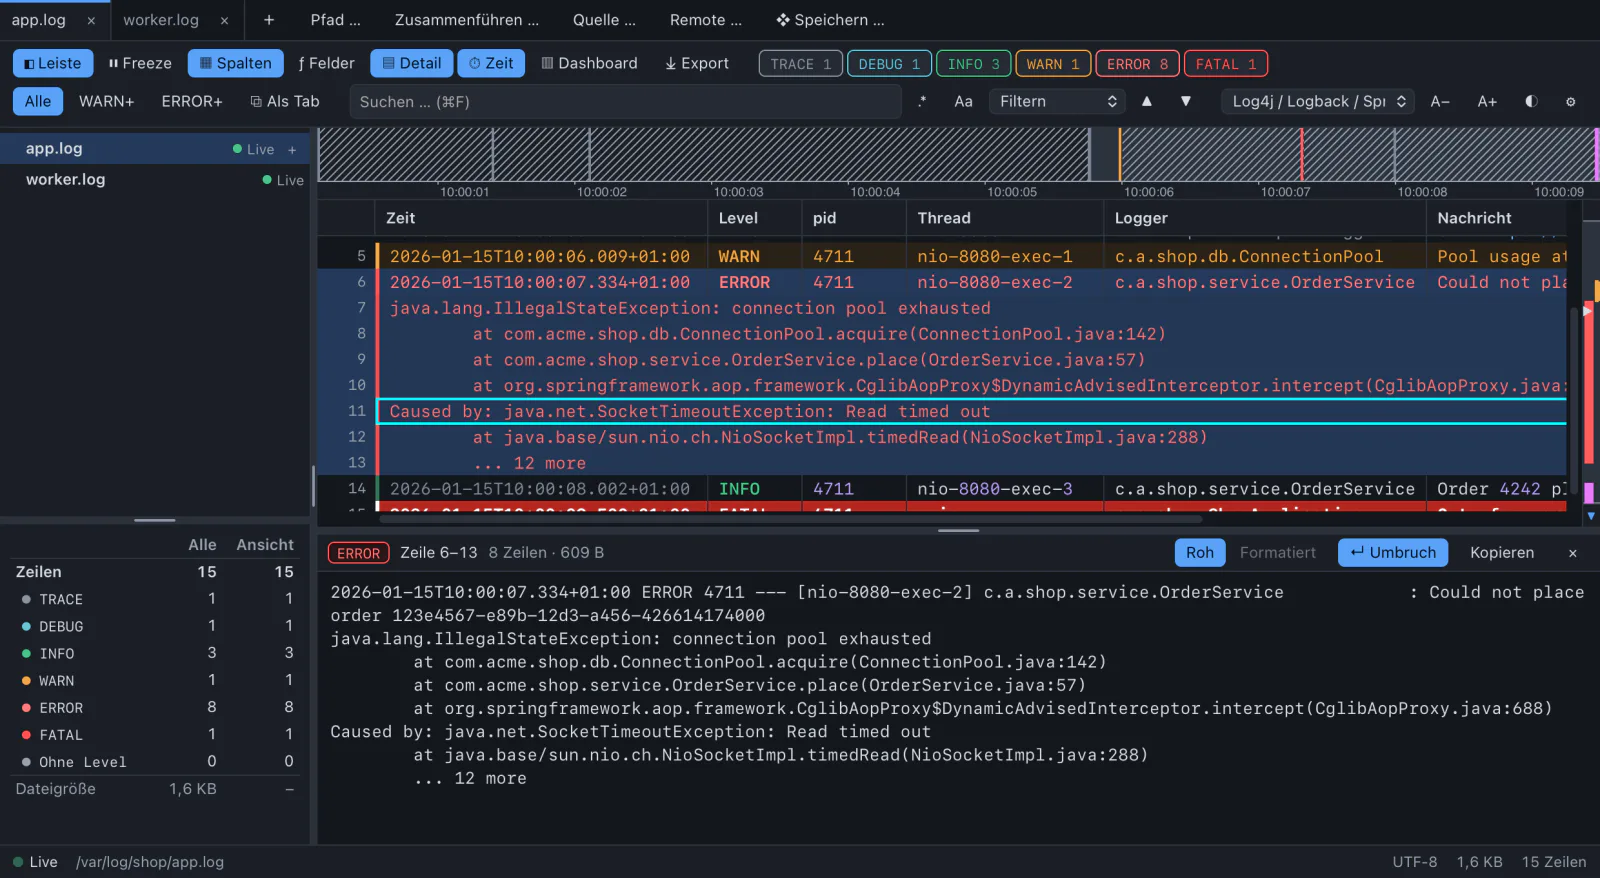
The whole entry of the selected line.

Head line and stack trace below the log, without the cut at the screen edge and whatever the filter hides. Embedded JSON or XML is indented and coloured by its own tokenizer, so 64-bit ids stay exact and fragments work.

Click other lines or step with the arrow keys to browse entry by entry.

D Enter · double click
app.log · detail
The detail panel with a formatted entry
500 MB · 5.1 M lines

Huge files

The backend keeps an index, not the text. First lines after 25 ms, fully indexed in about 2 seconds, 78 MB of index.

UTF-8 · UTF-16 · Latin-1

Encodings

UTF-8, UTF-16 by BOM, Latin-1 detection. Invalid bytes never stop it, ANSI colours are removed.

❄ P

Freeze

Holds a tab to read in peace. Lines, counts and position stay put while filters and search keep working. Resuming reads everything written in between.

WARN chapter 2 · find

Narrow five million lines down to one.

Search, a filter tree with real logic, and tabs that remember every step of the way.

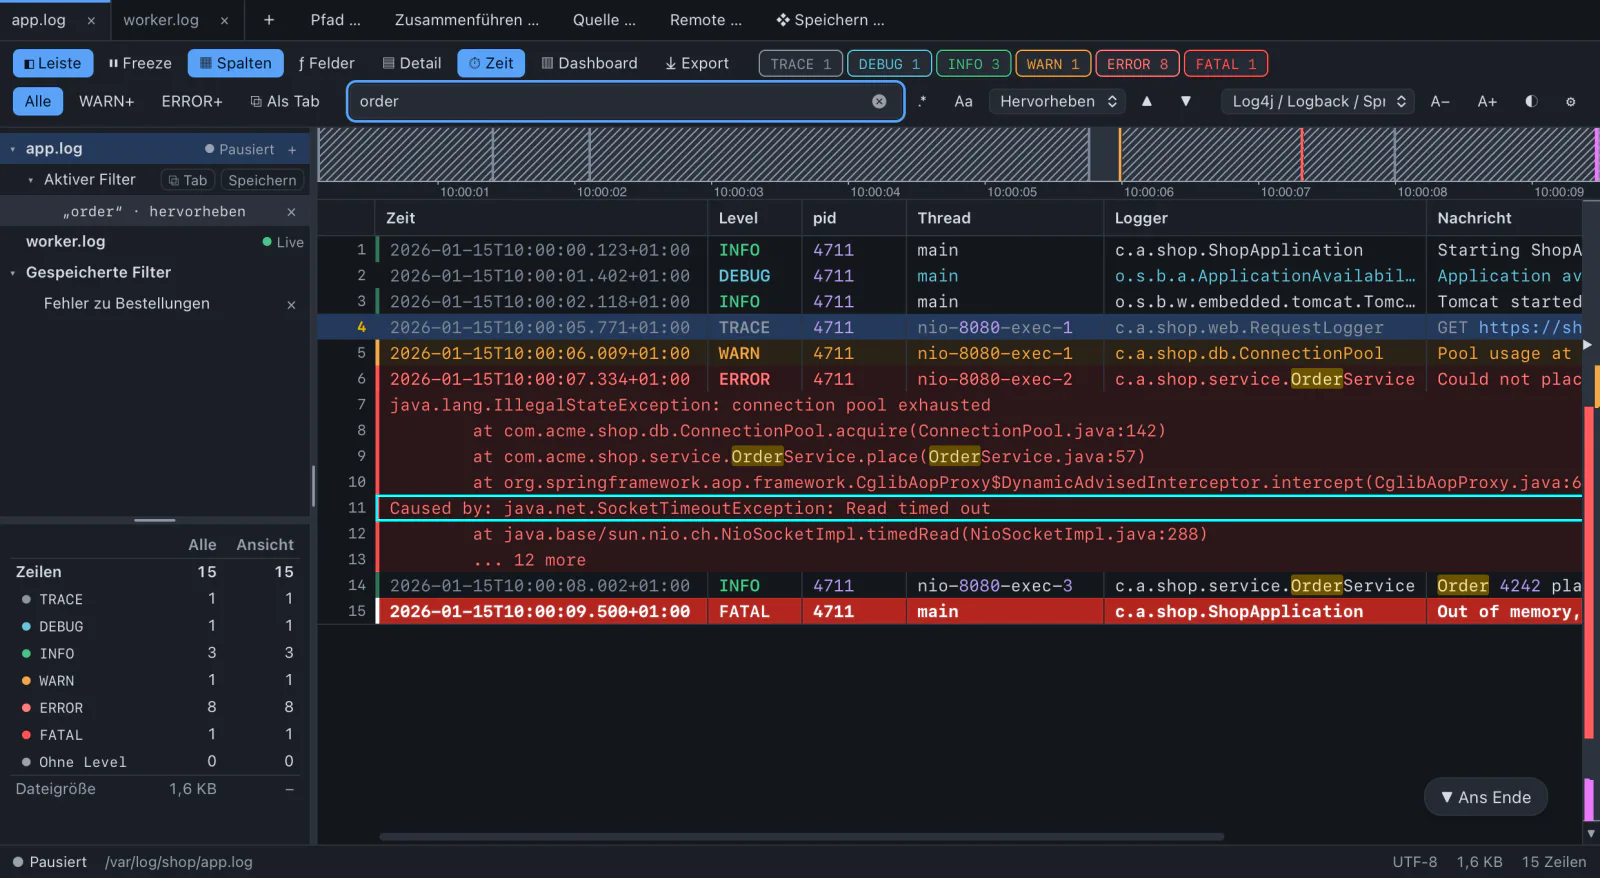
Search

Filter or highlight. Your choice per search.

Regular expressions, case sensitivity, jump between matches. Over 500 MB a full text search takes 0.7 s.

Cmd/Ctrl+F · Enter Shift+Enter matches
app.log · search
A search with highlighted matches

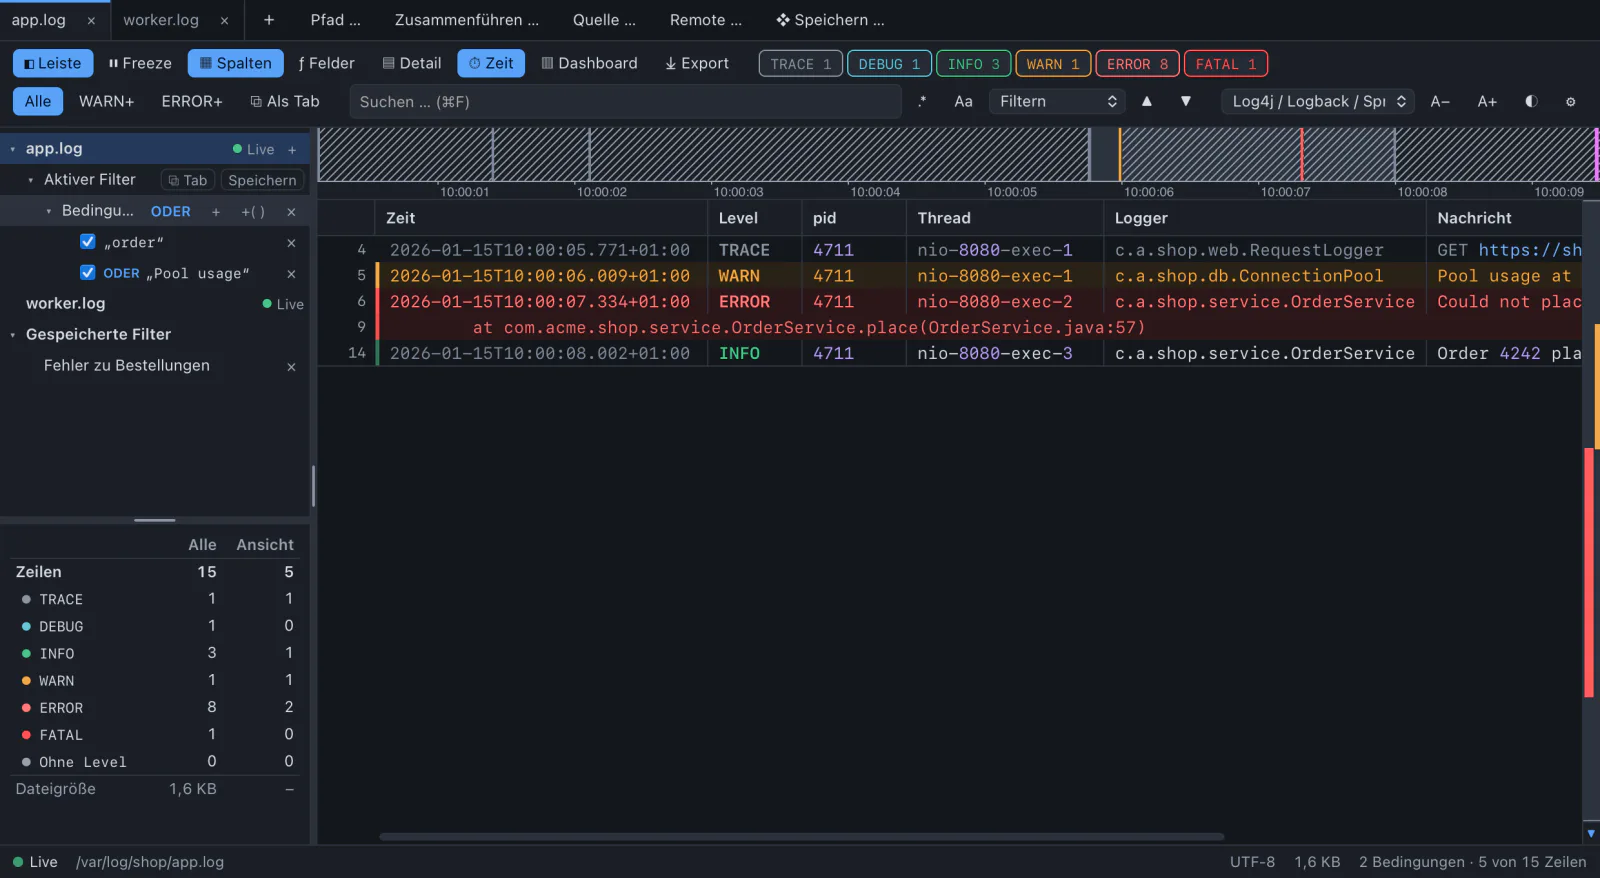
Filter tree

Conditions in groups, joined with AND or OR.

Text or regex, levels, a field (=, contains, regex, >, <, between), a time span, a section between a start and an end marker, line numbers. Each can be negated, switched off or dragged elsewhere.

Conditions hold for the whole entry: a request id in the head and “Timeout” in its stack trace match together. A broken regex shows its error right at its condition.

I filter on marked text · Shift+I exclude · > < section
app.log · filter tree
The filter tree with nested groups in the sidebar

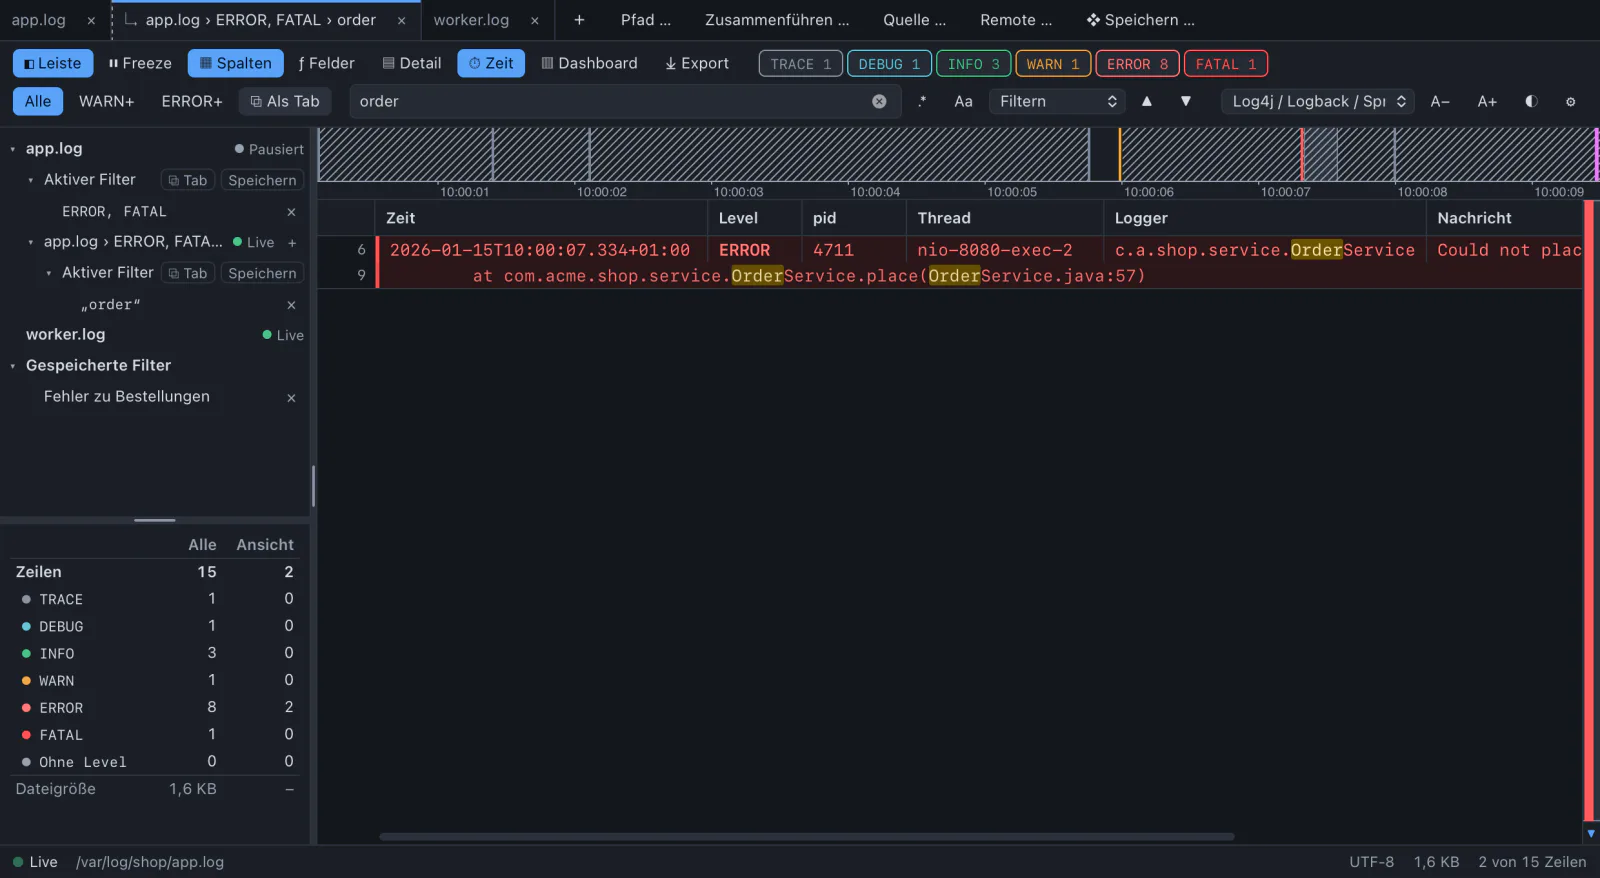
Filter tabs

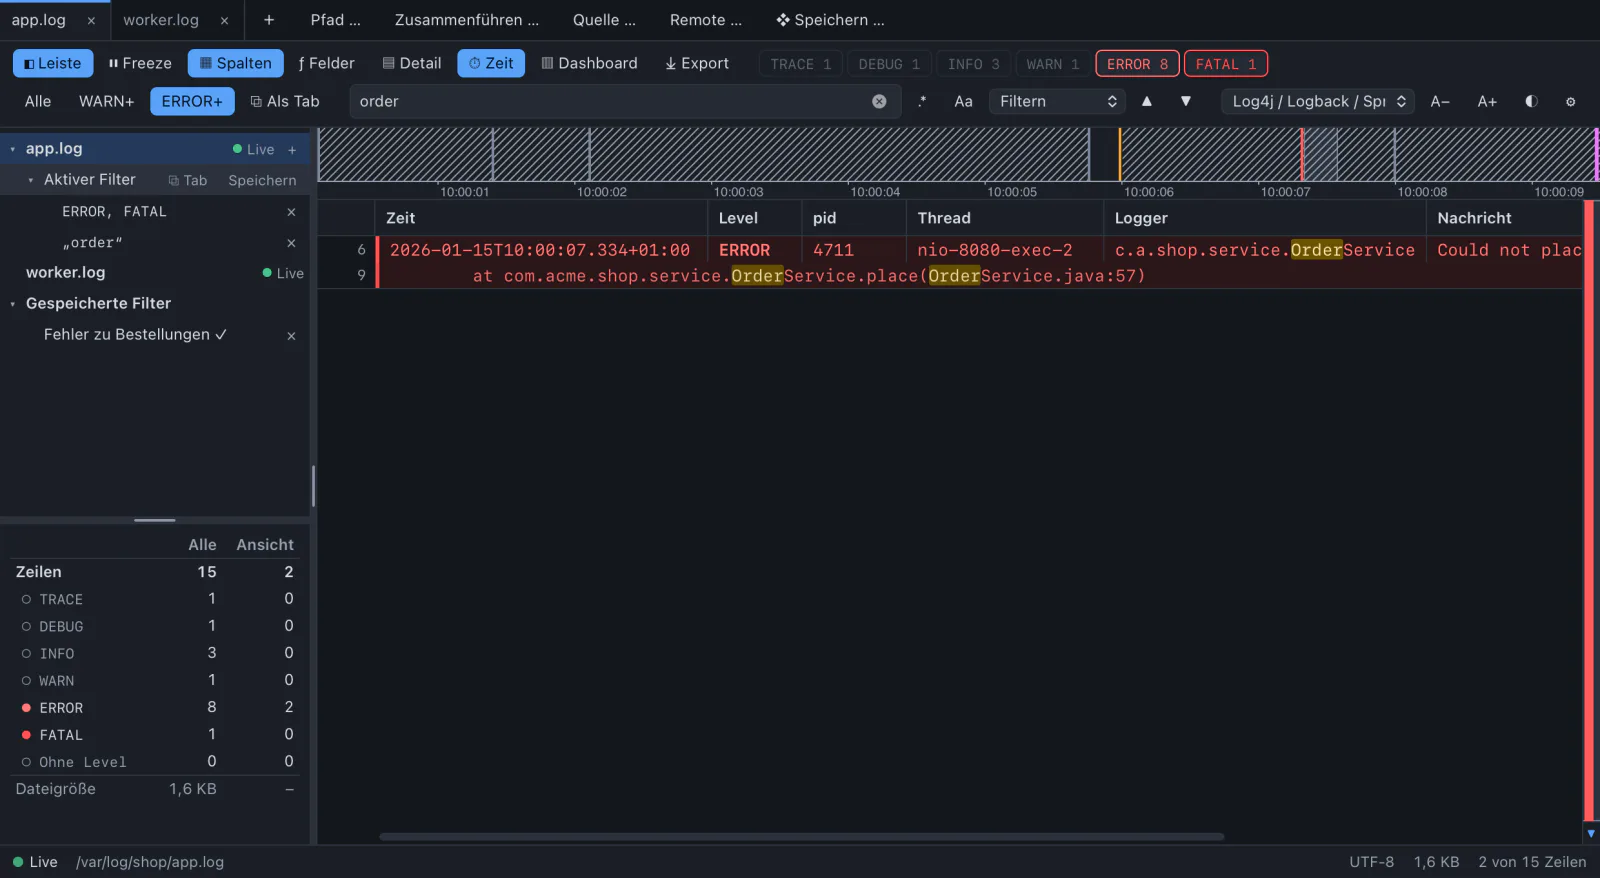
Drill down: app.log › ERROR › OrderService › 4711.

A filter opened as a tab shows the result of its parent and filters further. Each step stays open, so you can go back and work next to it. Change a filter above and every tab below updates live.

All tabs of a file share one index, one tail and the freeze. Up to 8 per file.

Cmd/Ctrl+Shift+T · T on a filter in the tree
app.log › ERROR › OrderService
Filter tabs as a chain right of their file

Fields from the message

cpu=72.3% mem=1.2GB took 340ms become columns.

On opening, the app looks at up to 2000 entries and offers what it finds in the status bar. Never as a dialog. Or mark a value and build a rule from it, with a preview of the hits.

Types are text, number, percent, duration and size. Units are converted, so took > 500 ms in the filter tree also finds 1.2s. The file stays as it is.

Fields
The fields dialog: suggested fields with examples
G

From the filter to the whole log

Shows the selected line of a filtered view in the whole log, the search kept as highlighting. Press again and the filter is back at the same line.

saved filters

Filters with a name

Save the active filter in the sidebar and apply it to any tab with one click. Saved filters keep their tree.

right click

Quick ways in

“Filter on …” on a line, “Filter by Thread = …” on a cell, “Section from here” and “up to here” for the selection.

ERROR chapter 3 · see

The shape of the whole file.

Where the errors are, when they happened, and how often. Before you read a single line.

Timeline

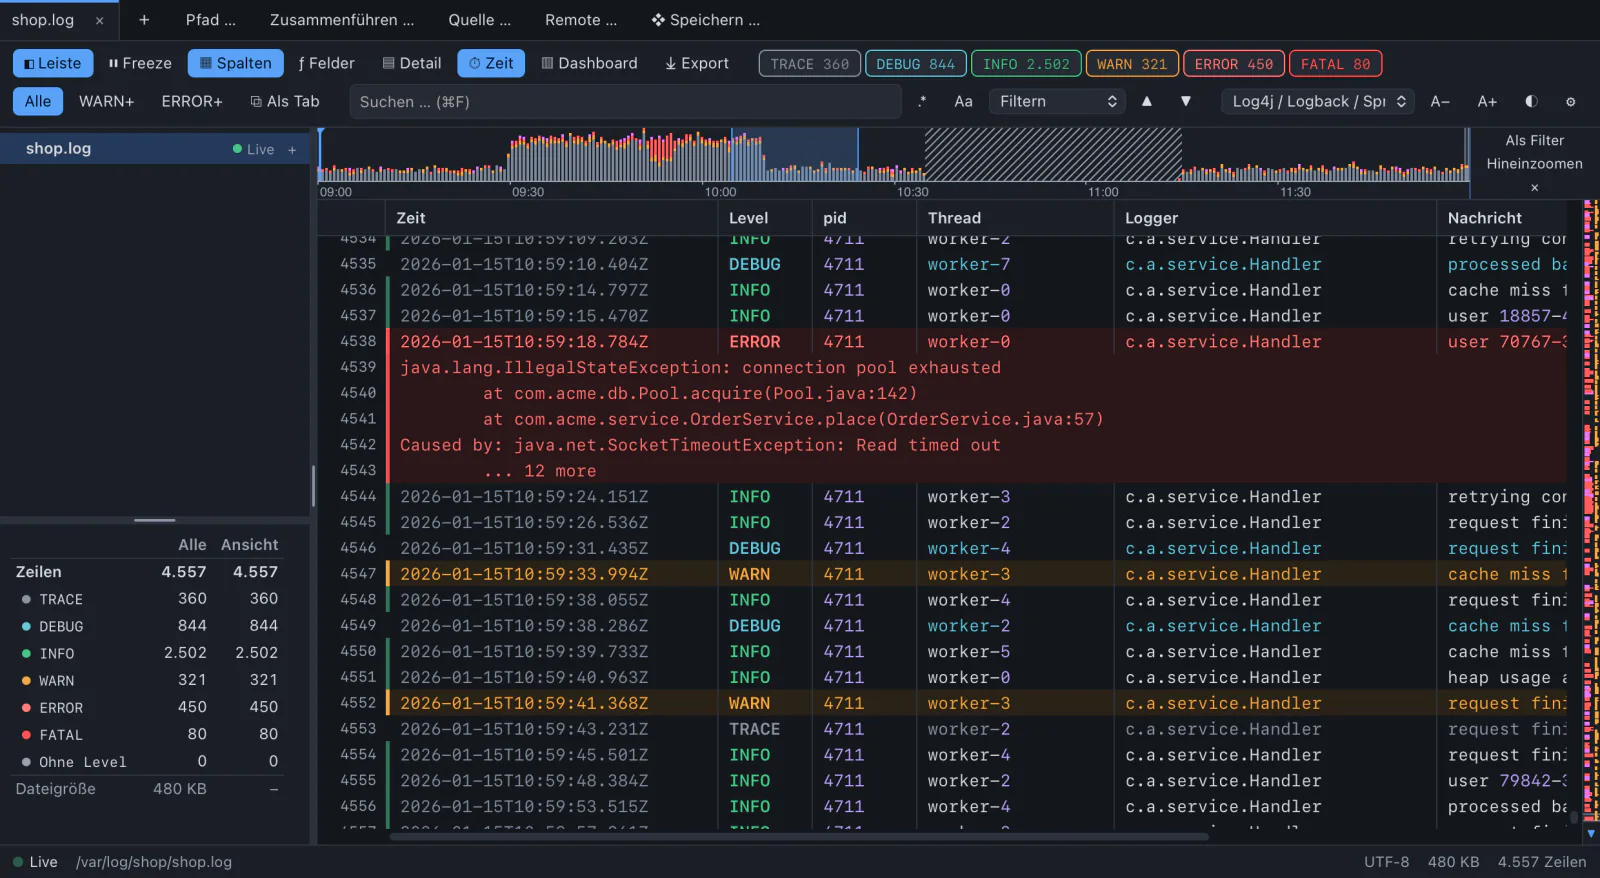
Entries over time, stacked by level.

A strip above the log shows peaks, bursts of errors and outages. A silence of ten times the usual spacing is hatched and named: “no entries 10:04–10:51”.

Click to jump to that time, drag to mark a window and use it as a filter or zoom into it. The wheel zooms too.

Z · arrows, Enter, + - on the strip
shop.log · timeline
The timeline with a burst of errors, a hatched outage and a marked window

Overview ruler

Errors, warnings, bookmarks, all at a glance.

A narrow bar right of the log. FATAL and ERROR share the left lane, warnings have the right one. The longer a bar, the denser its level there, so a busy log is not one solid colour and a single error is still a mark.

Click a mark to go to the next entry from that place. The selection stays.

M bookmark · N next bookmark
busy.log
The overview ruler on a busy log, dark

Dashboard

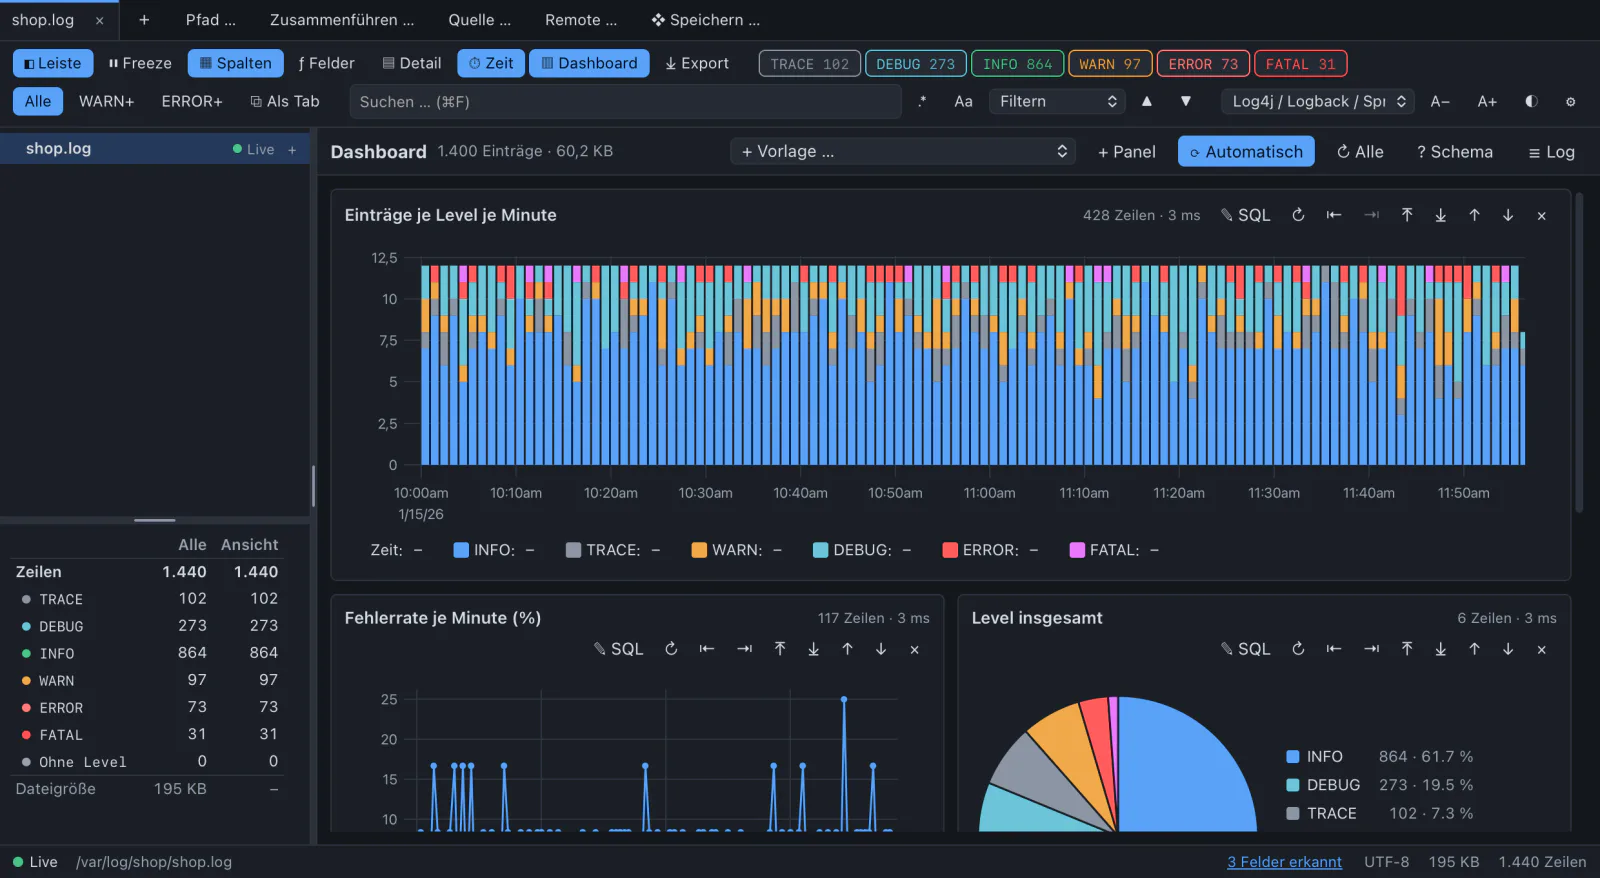
Charts over time, from SQL.

Errors per minute, the error rate, a measurement such as took as mean and maximum, entries per file of a merge. Line, area, bars, stacked bars, pie, table, single value.

A small SQLite database is built in the background from the index, one row per entry, never the message. bucket(ts, '1m') groups by minute. Click a point to jump to its first line, a bar without time axis to open a filter tab on it.

Queries only read: one statement, at most 10,000 rows and 10 seconds.

Cmd/Ctrl+Shift+D
app.log · dashboard
A dashboard with six panels
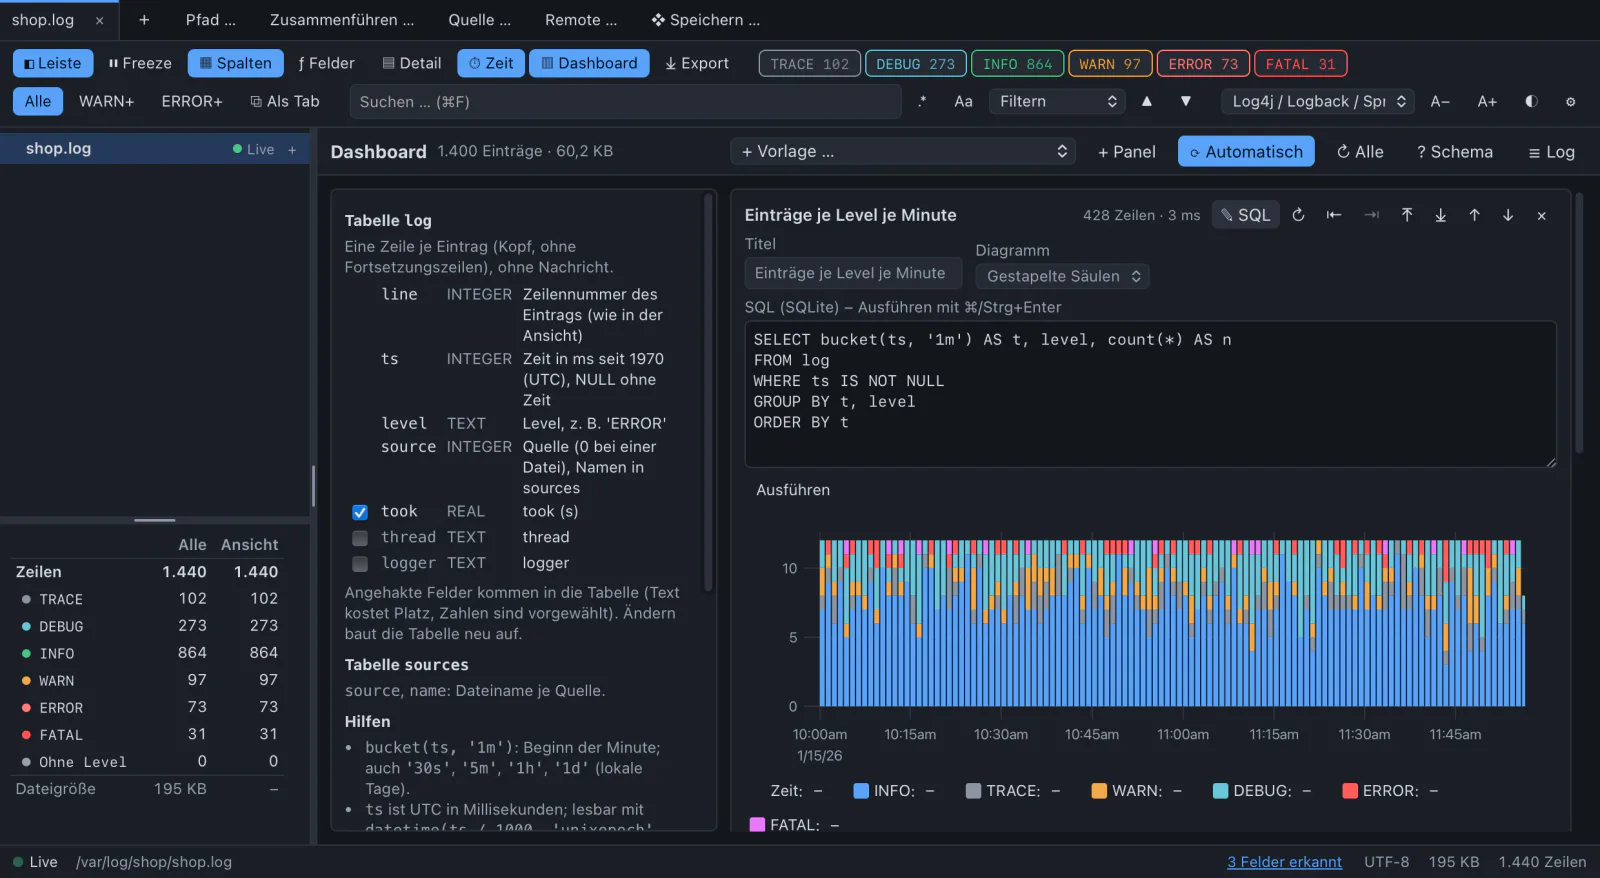
A panel with its SQL and the schema of the table
Every panel shows its SQL and the schema to change it.

Sidebar

Files, filters and statistics in one tree.

The open files with their state (live, new errors, frozen), the active filter of each file and filters saved under a name. Below it, lines per level for the whole file and for the current view.

Below 900 px window width it steps aside by itself.

Cmd/Ctrl+B
app.log · sidebar
The sidebar with tree and statistics

DEBUG chapter 4 · keep

Combine, export, hand over.

What you found should survive the afternoon, and reach the colleague who has to fix it.

Merge files

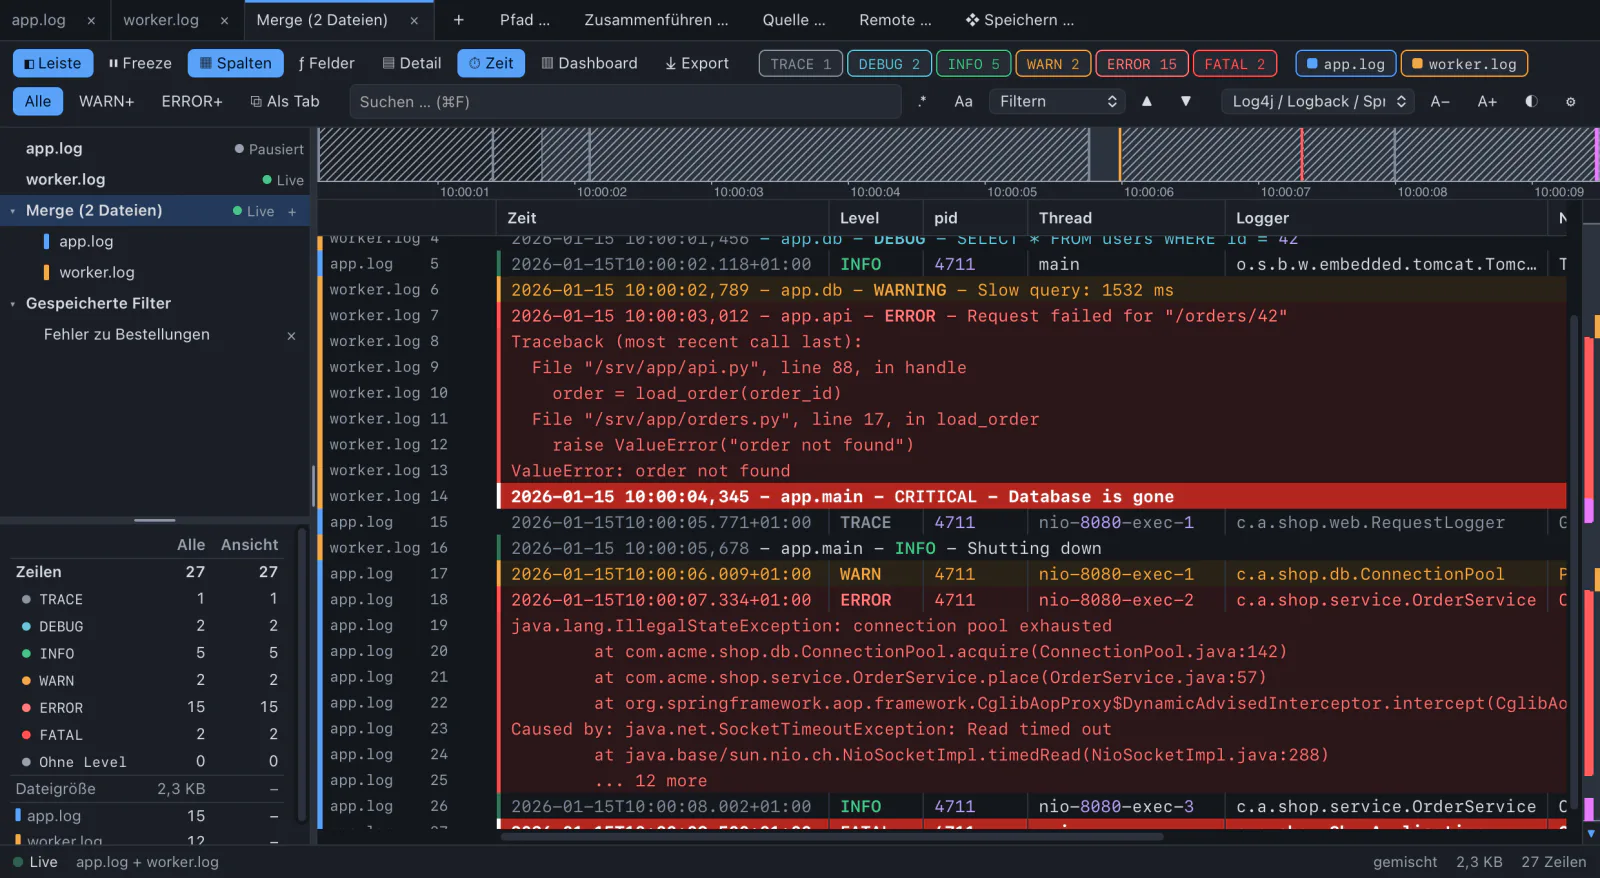
2 to 16 logs in one tab, sorted by timestamp.

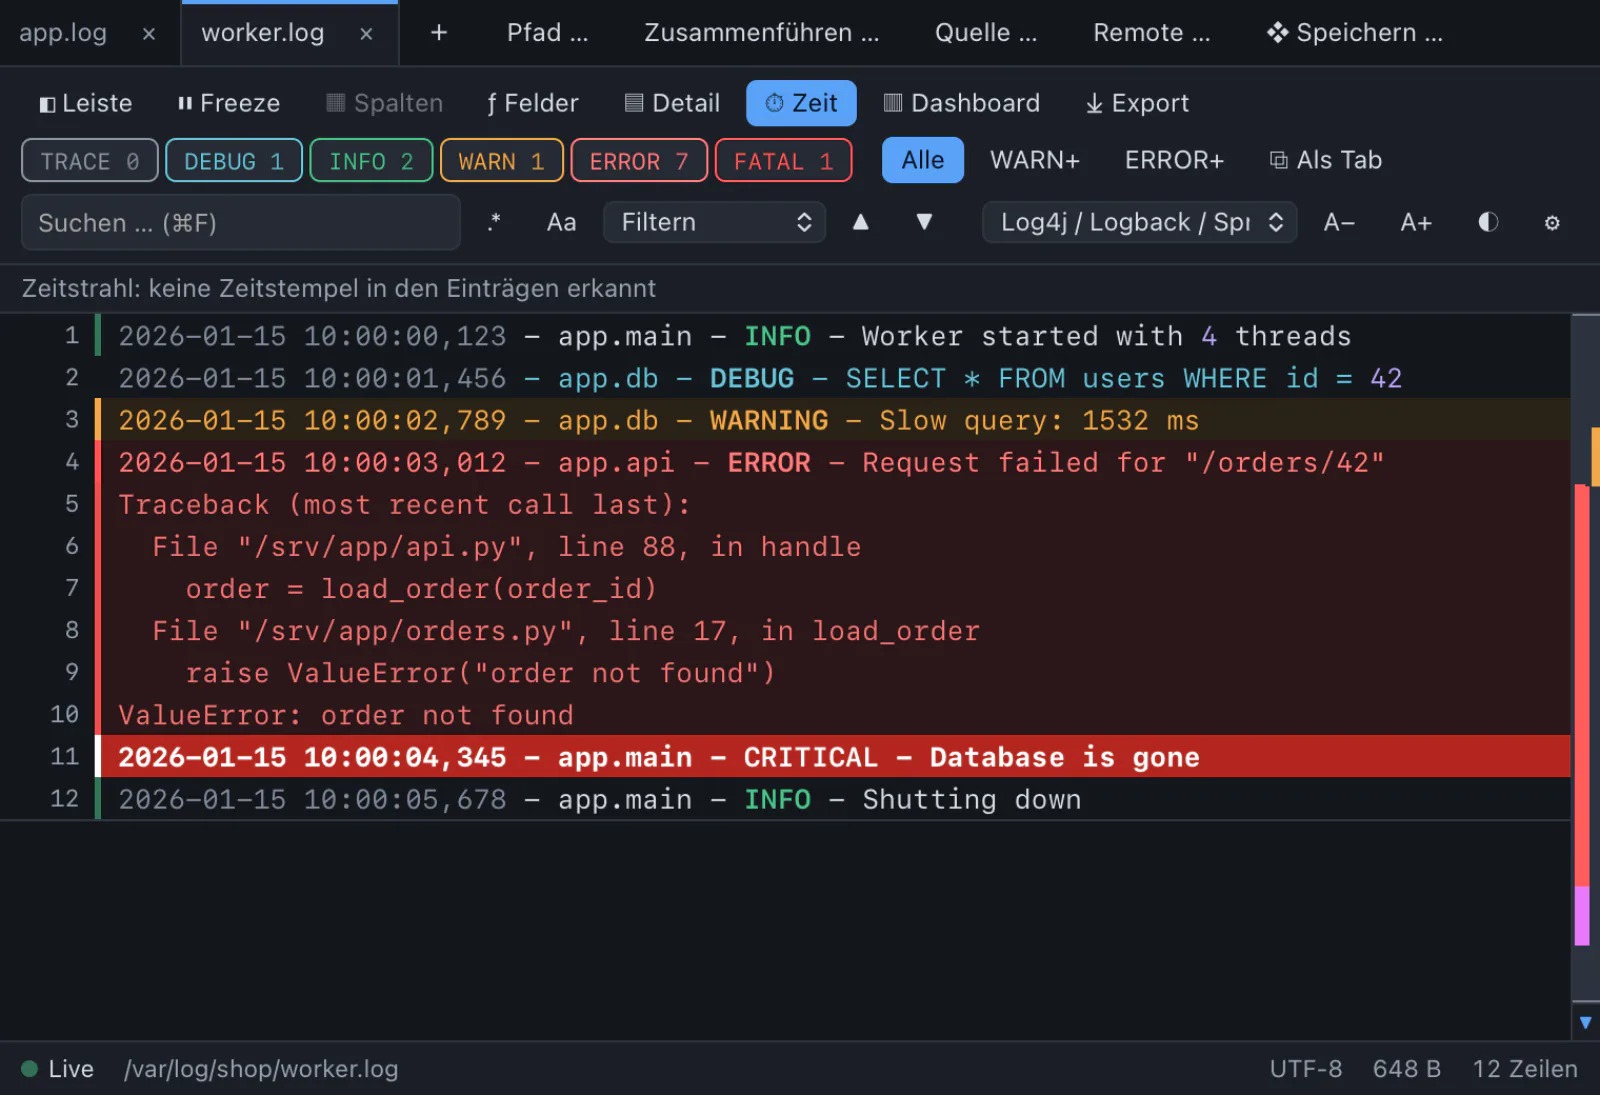
They read like the log of one process. Each line shows its file as a short name and a colour stripe; chips filter by file. New lines keep coming in live, held back up to a second so the files can catch up.

An entry that arrives later is appended and counted, and “sort again” puts it in place.

Cmd/Ctrl+Shift+M
app.log + worker.log
Two merged files with colour stripes
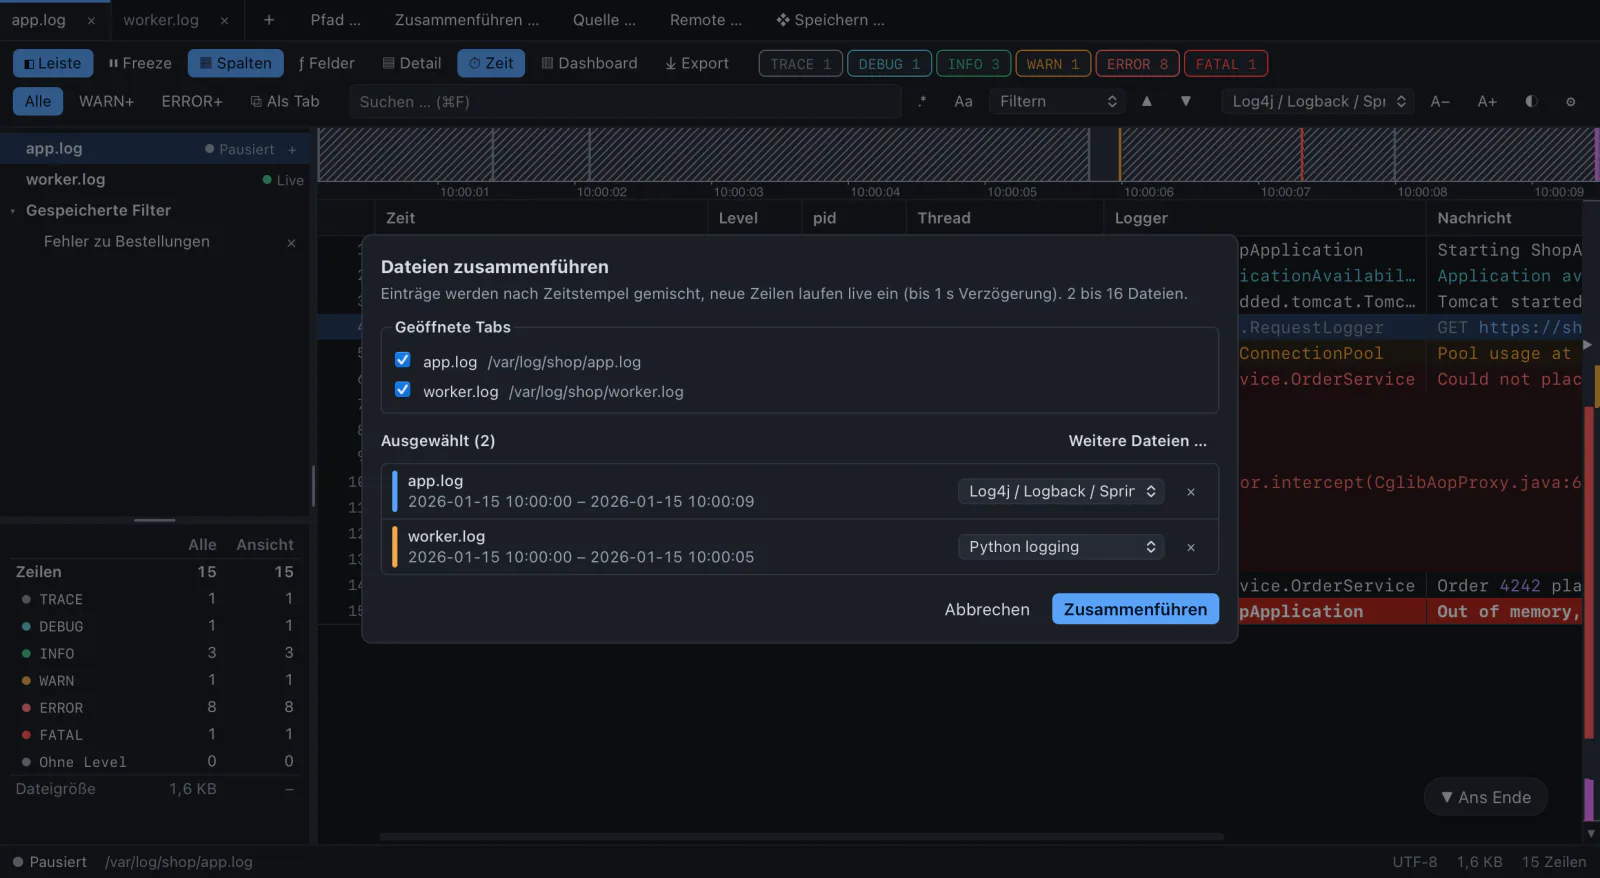
The merge dialog with profile, first and last time per file
The dialog suggests a profile per file and shows its first and last time.
⤓ Cmd/Ctrl+Shift+E

Export

The selection, the view or the whole file as text, CSV or JSON Lines. Written in the background with progress, a cancelled export leaves nothing behind. CSV defuses formula cells.

✎ Shift+M

Notes

A short note on an entry: a pencil in the gutter, a diamond on the ruler, the text in the detail panel. Like bookmarks, notes belong to the file.

❖ .lcw

Workspace

Open files and merges, every tab with its filter and chain, bookmarks, notes and layout in one JSON file. Bookmarks are anchored by a hash of the line and found again after lines were inserted.

markdown · jira

Share

Copy the selected lines with file, lines, time span and filter as a head, the notes as a list. Ready for the ticket.

$ log-commander a.log b.log

Command line

Start with one or more files, drop them on the window, or type a path with ~. Recent files are on the start screen.

● new errors

Tabs that tell

A red dot marks a tab with new errors in the background. Copying takes whole entries, level colours are adjustable.

INFO comfort

Yours to arrange.

Colour schemes

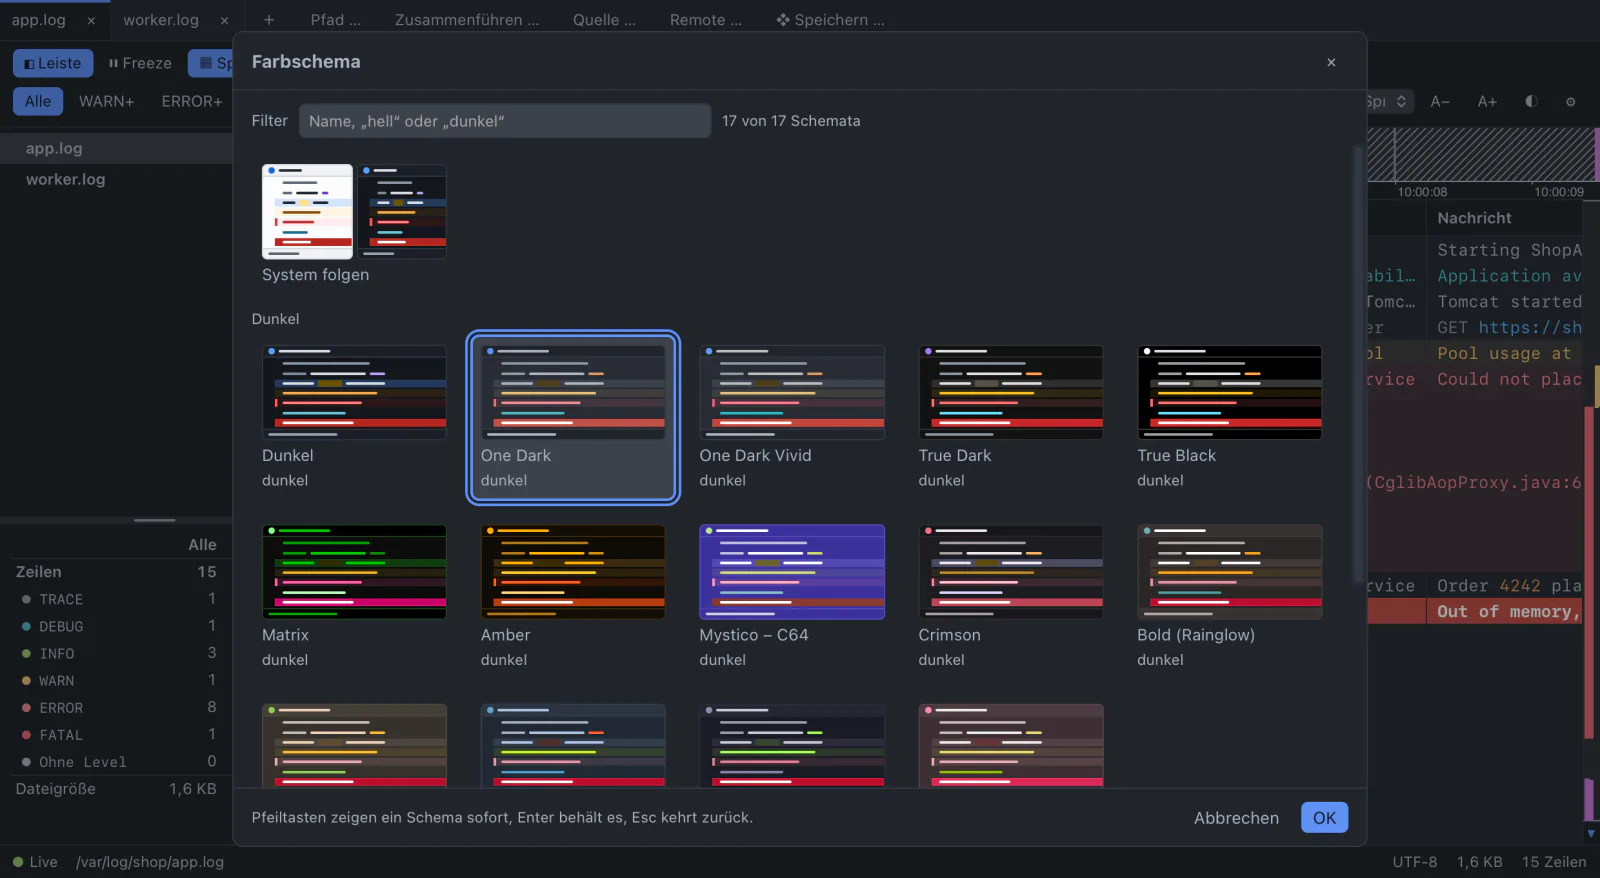
17 schemes in a gallery with previews.

Dark and light plus One Dark, True Black, Matrix, Amber, Solarized Light, Mystico – C64, Crimson and five Rainglow themes. Arrow keys show a scheme at once, Enter keeps it, Esc goes back.

Every scheme passes WCAG AA. The window frame follows it.

Cmd/Ctrl+Alt+T
Colour scheme
The colour scheme picker with preview tiles

Keyboard shortcuts

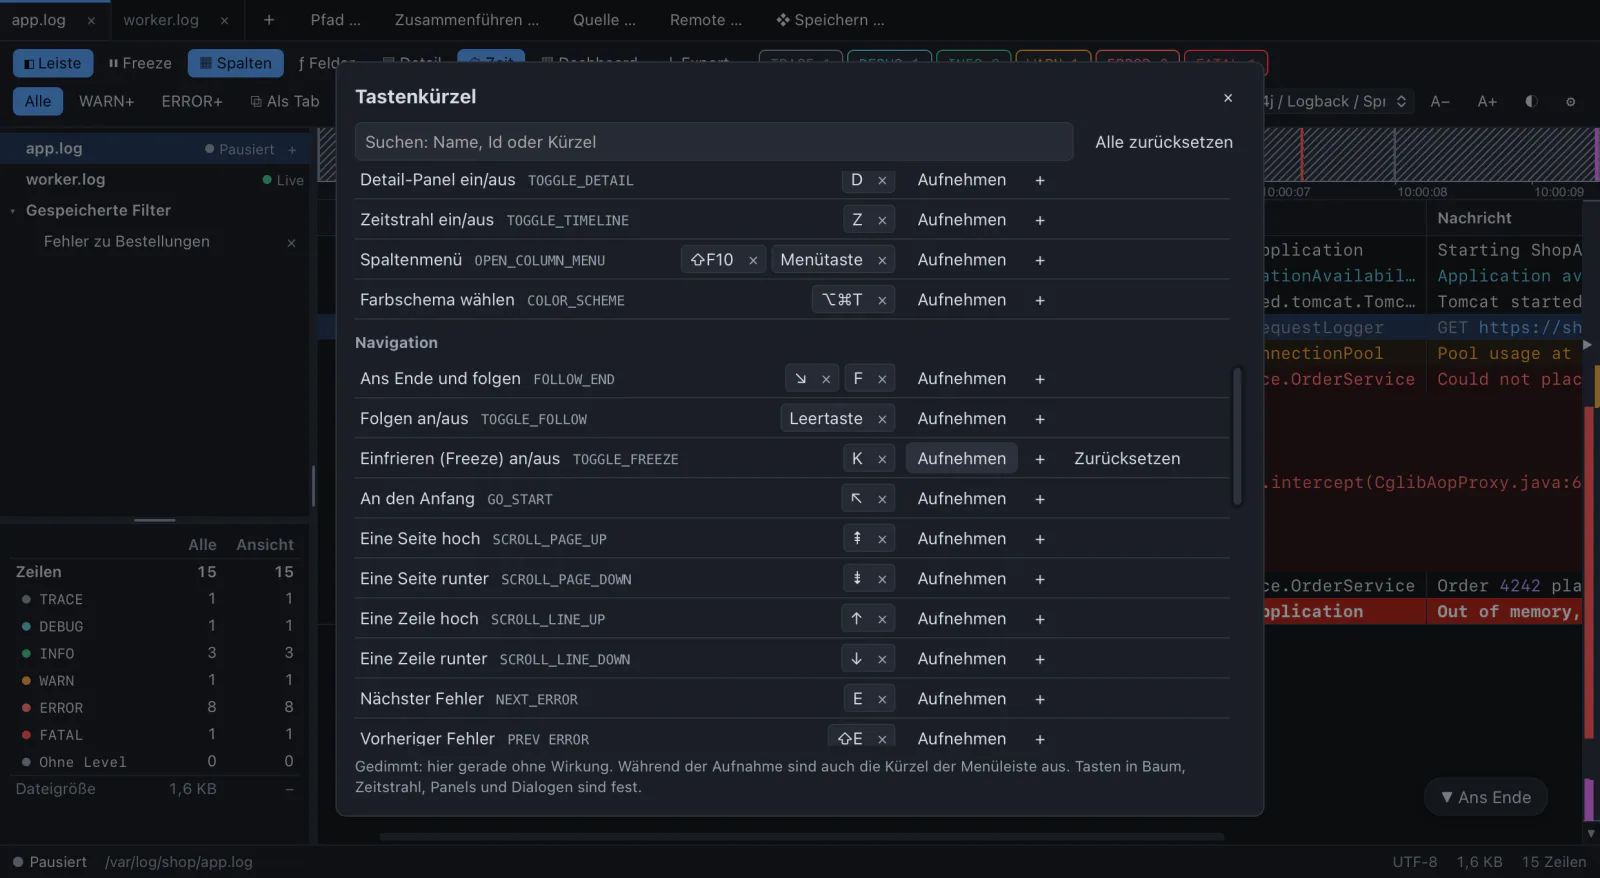
Every shortcut is an action you can rebind.

Search the list, record a new key, remove or reset. Your shortcuts are stored in the settings and the native menu shows them too.

Cmd/Ctrl+Shift+K · ? overview
All default shortcuts
Keyboard shortcuts
The shortcut editor: search, record, reset

Small windows welcome

Next to your editor, on half a screen.

The sidebar steps aside below 900 px and comes back by itself. Font size, level colours, detail panel, timeline and ruler are switches in the settings.

app.log
Log Commander in a narrow window

$ log-commander /var/log/app.log

Open the log.